

You are a new developer or want to manage your own application, the following 20 basic sysadmin commands can help you better understand your applications. They can also help you describe problems to sysadmins troubleshooting why an application might work locally but not on a remote host. These commands apply to Linux development environments, containers, virtual machines (VMs), and bare metal.
1. curl
curl transfers a URL. Use this command to test an application’s endpoint or connectivity to an upstream service endpoint. curl can be useful for determining if your application can reach another service, such as a database, or checking if your service is healthy.
As an example, imagine your application throws an HTTP 500 error indicating it can’t reach a MongoDB database:
HTTP/1.0 500 INTERNAL SERVER ERROR
The -I option shows the header information and the -s option silences the response body. Checking the endpoint of your database from your local desktop:
HTTP/1.0 200 OK
So what could be the problem? Check if your application can get to other places besides the database from the application host:
HTTP/1.1 200 OK
That seems to be okay. Now try to reach the database from the application host. Your application is using the database’s hostname, so try that first:
curl: (6) Couldn‘t resolve host ‘database‘
This indicates that your application cannot resolve the database because the URL of the database is unavailable or the host (container or VM) does not have a nameserver it can use to resolve the hostname.
2. python -m json.tool / jq
After you issue curl, the output of the API call may be difficult to read.
Sometimes, you want to pretty-print the JSON output to find a specific entry. Python has a built-in JSON library that can help with this. You use python -m json.tool to indent and organize the JSON. To use Python’s JSON module, pipe the output of a JSON file into the python -m json.tool command.
{“title”:“Person”,“type”:“object”,“properties”:{“firstName”:{“type”:“string”},“lastName”:{“type”:“string”},“age”:{“description”:“Age in years”,“type”:“integer”,“minimum”:0}},“required”:[“firstName”,“lastName”]}
To use the Python library, pipe the output to Python with the -m (module) option.
{
“properties”: {
“age”: {
“description”: “Age in years”,
“minimum”: 0,
“type”: “integer”
},
“firstName”: {
“type”: “string”
},
“lastName”: {
“type”: “string”
}
},
“required”: [
“firstName”,
“lastName”
],
“title”: “Person”,
“type”: “object”
}
For more advanced JSON parsing, you can install jq. jq provides some options that extract specific values from the JSON input. To pretty-print like the Python module above, simply apply jq to the output.
{
“title”: “Person”,
“type”: “object”,
“properties”: {
“firstName”: {
“type”: “string”
},
“lastName”: {
“type”: “string”
},
“age”: {
“description”: “Age in years”,
“type”: “integer”,
“minimum”: 0
}
},
“required”: [
“firstName”,
“lastName”
]
}
3. ls
ls lists files in a directory. Sysadmins and developers issue this command quite often. In the container space, this command can help determine your container image’s directory and files. Besides looking up your files, ls can help you examine your permissions. In the example below, you can’t run myapp because of a permissions issue. When you check the permissions using ls -l, you realize that the permissions do not have an “x” in -rw-r–r–, which are read and write only.
bash: ./myapp: Permission denied
$ ls -l myapp
-rw-r–r–. 1 root root 33 Jul 21 18:36 myapp
4. tail
tail displays the last part of a file. You usually don’t need every log line to troubleshoot. Instead, you want to check what your logs say about the most recent request to your application. For example, you can use tail to check what happens in the logs when you make a request to your Apache HTTP server.
example_tail.png
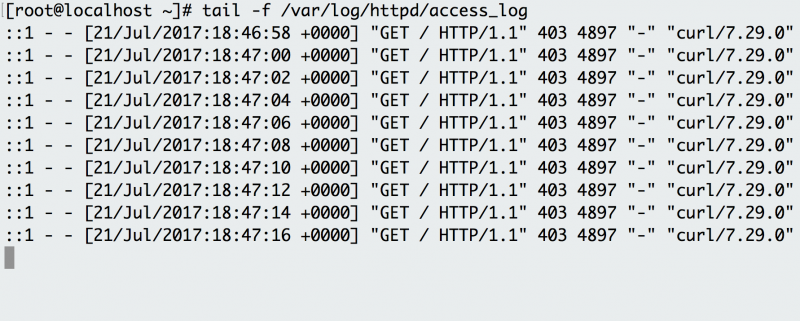
Use tail -f to follow Apache HTTP logs and see the requests as they happen.
The -f option indicates the “follow” option, which outputs the log lines as they are written to the file. The example has a background script that accesses the endpoint every few seconds and the log records the request. Instead of following the log in real time, you can also use tail to see the last 100 lines of the file with the -n option.
$ tail -n 100 /var/log/httpd/access_log5. cat
cat concatenates and prints files. You might issue cat to check the contents of your dependencies file or to confirm the version of the application that you have already built locally.
flask
flask_pymongo
The example above checks whether your Python Flask application has Flask listed as a dependency.
6. grep
grep searches file patterns. If you are looking for a specific pattern in the output of another command, grep highlights the relevant lines. Use this command for searching log files, specific processes, and more. If you want to see if Apache Tomcat starts up, you might become overwhelmed by the number of lines. By piping that output to the grep command, you isolate the lines that indicate server startup.
01-Jul-2017 18:03:47.542 INFO [main] org.apache.catalina.startup.Catalina.start Server startup in 681 ms
7. ps
ps shows process status. Use this command to determine a running application or confirm an expected process. For example, if you want to check for a running Tomcat web server, you use ps with its options to obtain the process ID of Tomcat.
UID PID PPID C STIME TTY TIME CMD
root 1 0 2 18:55 ? 00:00:02 /docker-java-home/jre/bi
root 59 0 0 18:55 pts/0 00:00:00 /bin/sh
root 75 59 0 18:57 pts/0 00:00:00 ps -ef
For even more legibility, use ps and pipe it to grep.
root 1 0 1 18:55 ? 00:00:02 /docker-java-home/jre/bi
8. env
env allows you to set or print the environment variables. During troubleshooting, you may find it useful for checking if the wrong environment variable prevents your application from starting. In the example below, this command is used to check the environment variables set on your application’s host.
PYTHON_PIP_VERSION=9.0.1
HOME=/root
DB_NAME=test
PATH=/usr/local/bin:/usr/local/sbin
LANG=C.UTF-8
PYTHON_VERSION=3.4.6
PWD=/
DB_URI=mongodb://database:27017/test
Notice that the application is using Python3 and has environment variables to connect to a MongoDB database.
9. top
top displays and updates sorted process information. Use this tool to determine which processes are running and how much memory and CPU they consume. A common case occurs when you run an application and it dies a minute later. First, you check the application’s return error, which is a memory error.
Traceback (most recent call last):
MemoryError
Is your application really out of memory? To confirm, use top to determine how much CPU and memory your application consumes. When issuing top, you notice a Python application using most of the CPU, with its memory usage climbing, and suspect it is your application. While it runs, you hit the “C” key to see the full command and reverse-engineer if the process is your application. It turns out to be your memory-intensive application (memeater.py). When your application has run out of memory, the system kills it with an out-of-memory (OOM) error.
example_top.png

The memory and CPU usage of the application increases, eventually being OOM-killed.
example_topwithc.png

By hitting the “C” key, you can see the full command that started the application.
In addition to checking your own application, you can use top to debug other processes that utilize CPU or memory.
10. netstat
netstat shows the network status. This command shows network ports in use and their incoming connections. However, netstat does not come out-of-the-box on Linux. If you need to install it, you can find it in the net-tools package. As a developer who experiments locally or pushes an application to a host, you may receive an error that a port is already allocated or an address is already in use. Using netstat with protocol, process and port options demonstrates that Apache HTTP server already uses port 80 on the below host.
example_netstat.png

Using netstat -tulpn shows that Apache already uses port 80 on this machine.
11. ip address
If ip address does not work on your host, it must be installed with the iproute2 package. ip address shows the interfaces and IP addresses of your application’s host. You use ip address to verify your container or host’s IP address. For example, when your container is attached to two networks, ip address can show which interface connects to which network. For a simple check, you can always use the ip address command to get the IP address of the host. The example below shows that the web tier container has an IP address of 172.17.0.2 on interface eth0.
example_ipaddr_0.png

Using ip address shows that the IP address of the eth0 interface is 172.17.0.2
12. lsof
lsof lists the open files associated with your application. On some Linux machine images, you need to install lsof with the lsof package. In Linux, almost any interaction with the system is treated like a file. As a result, if your application writes to a file or opens a network connection, lsof will reflect that interaction as a file. Similar to netstat, you can use lsof to check for listening ports. For example, if you want to check if port 80 is in use, you use lsof to check which process is using it. Below, you can see that httpd (Apache) listens on port 80. You can also use lsof to check the process ID of httpd, examining where the web server’s binary resides (/usr/sbin/httpd).
example_lsof.png

Lsof shows that httpd listens on port 80. Examining httpd’s process ID also shows all the files httpd needs in order to run.
The name of the open file in the list of open files helps pinpoint the origin of the process, specifically Apache.
13. df
You can use df (display free disk space) to troubleshoot disk space issues. When you run your application on a container orchestrator, you might receive an error message signaling a lack of free space on the container host. While disk space should be managed and optimized by a sysadmin, you can use df to figure out the existing space in a directory and confirm if you are indeed out of space.
example_df.png

Df shows the disk space for each filesystem, its absolute space, and availability.
The -h option prints out the information in human-readable format. The example above shows plenty of disk space on this host.
14. du
To retrieve more detailed information about which files use the disk space in a directory, you can use the du command. If you wanted to find out which log takes up the most space in the /var/log directory, for example, you can use du with the -h (human-readable) option and the -s option for the total size.
1.8M /var/log/anaconda
384K /var/log/audit
4.0K /var/log/boot.log
0 /var/log/chrony
4.0K /var/log/cron
4.0K /var/log/maillog
64K /var/log/messages
The example above reveals the largest directory under /var/log to be /var/log/audit. You can use du in conjunction with df to determine what utilizes the disk space on your application’s host.
15. id
To check the user running the application, use the id command to return the user identity. The example below uses Vagrant to test the application and isolate its development environment. After you log into the Vagrant box, if you try to install Apache HTTP Server (a dependency) the system states that you cannot perform the command as root. To check your user and group, issue the id command and notice that you are running as the “vagrant” user in the “vagrant” group.
Loaded plugins: fastestmirror
You need to be root to perform this command.
$ id
uid=1000(vagrant) gid=1000(vagrant) groups=1000(vagrant) context=unconfined_u:unconfined_r:unconfined_t:s0-s0:c0.c1023
To correct this, you must run the command as a superuser, which provides elevated privileges.
16. chmod
When you run your application binary for the first time on your host, you may receive the error message “permission denied.” As seen in the example for ls, you can check the permissions of your application binary.
total 4
-rw-rw-r–. 1 vagrant vagrant 34 Jul 11 02:17 test.sh
This shows that you don’t have execution rights (no “x”) to run the binary. chmod can correct the permissions to enable your user to run the binary.
[vagrant@localhost ~]$ ls -l
total 4
-rwxrwxr-x. 1 vagrant vagrant 34 Jul 11 02:17 test.sh
As demonstrated in the example, this updates the permissions with execution rights. Now when you try to execute your binary, the application doesn’t throw a permission-denied error. Chmod may be useful when you load a binary into a container as well. It ensures that your container has the correct permissions to execute your binary.
17. dig / nslookup
A domain name server (DNS) helps resolve a URL to a set of application servers. However, you may find that a URL does not resolve, which causes a connectivity issue for your application. For example, say you attempt to access your database at the mydatabase URL from your application’s host. Instead, you receive a “cannot resolve” error. To troubleshoot, you try using dig (DNS lookup utility) or nslookup (query Internet name servers) to figure out why the application can’t seem to resolve the database.
Server: 10.0.2.3
Address: 10.0.2.3#53** server can‘t find mydatabase: NXDOMAIN
Using nslookup shows that mydatabase can’t be resolved. Trying to resolve with dig yields the same result.
$ dig mydatabase
; <<>> DiG 9.9.4-RedHat-9.9.4-50.el7_3.1 <<>> mydatabase
;; global options: +cmd
;; connection timed out; no servers could be reached
These errors could be caused by many different issues. If you can’t debug the root cause, reach out to your sysadmin for more investigation. For local testing, this issue may indicate that your host’s nameservers aren’t configured appropriately. To use these commands, you will need to install the BIND Utilities package.
18. iptables
iptables blocks or allows traffic on a Linux host, similar to a network firewall. This tool may prevent certain applications from receiving or transmitting requests. More specifically, if your application has difficulty reaching another endpoint, iptables may be denying traffic to the endpoint. For example, imagine your application’s host cannot reach Opensource.com. You use curl to test the connection.
* About to connect() to opensource.com port 80 (#0)
* Trying 54.204.39.132…
* Connection timed out
* Failed connect to opensource.com:80; Connection timed out
* Closing connection 0
curl: (7) Failed connect to opensource.com:80; Connection timed out
The connection times out. You suspect that something might be blocking the traffic, so you show the iptables rules with the -S option.
-P INPUT DROP
-P FORWARD DROP
-P OUTPUT DROP
-A INPUT -p tcp -m tcp –dport 22 -j ACCEPT
-A INPUT -i eth0 -p udp -m udp –sport 53 -j ACCEPT
-A OUTPUT -p tcp -m tcp –sport 22 -j ACCEPT
-A OUTPUT -o eth0 -p udp -m udp –dport 53 -j ACCEPT
The first three rules show that traffic drops by default. The remaining rules allow SSH and DNS traffic. In this case, follow up with your sysadmin if you require a rule to allow traffic to external endpoints. If this is a host you use for local development or testing, you can use the iptables command to allow the correct traffic. Use caution when adding rules that allow traffic to your host.
19. sestatus
You usually find SELinux (a Linux security module) enforced on an application host managed by an enterprise. SELinux provides least-privilege access to processes running on the host, preventing potentially malicious processes from accessing important files on the system. In some situations, an application needs to access a specific file but may throw an error. To check if SELinux blocks the application, use tail and grep to look for a “denied” message in the /var/log/audit logging. Otherwise, you can check to see if the box has SELinux enabled by using sestatus.
SELinux status: enabled
SELinuxfs mount: /sys/fs/selinux
SELinux root directory: /etc/selinux
Loaded policy name: targeted
Current mode: enforcing
Mode from config file: enforcing
Policy MLS status: enabled
Policy deny_unknown status: allowed
Max kernel policy version: 28
The output above indicates that the application’s host has SELinux enabled. On your local development environment, you can update SELinux to be more permissive. If you need help with a remote host, your sysadmin can help you determine the best practice for allowing your application to access the file it needs.
20. history
When you issue so many commands for testing and debugging, you may forget the useful ones! Every shell has a variant of the history command. It shows the history of commands you have issued since the start of the session. You can use history to log which commands you used to troubleshoot your application. For example, when you issue history over the course of this article, it shows the various commands you experimented with and learned.
1 clear
2 df -h
3 du
What if you want to execute a command in your previous history, but you don’t want to retype it? Use ! before the command number to re-execute.
example_history.png

Adding ! before the command number you want to execute issues the command again.
Basic commands can enhance your troubleshooting expertise when determining why your application works in one development environment but perhaps not in another. Many sysadmins leverage these commands to debug problems with systems. Understanding some of these useful troubleshooting commands can help you communicate with sysadmins and resolve issues with your application.
sources:opensource.com


Leave a Comment